Feed the World with Smart Farming, not
more CO2
Demand
for calories in food and feed will likely double by 2050. Under
current practices, rich nations would meet the demand with more
pressure on resources and more greenhouse gas emissions; the
poorest nations would clear extensive areas of land for cultivation.
By transferring techniques that have led to high-yield agriculture
from the wealthy nations to the poorest, the future demand can
be met without much clearing of land, and without more greenhouse
gas impacts from agriculture.
|
|
|
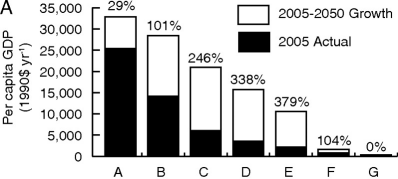
Figure
A : Gross Domestic Product (GDP) per person,
in dollars ($)/year in 2005 (black), and increase expected
to 2050 (white), with % increase above bar. Countries
are grouped in seven categories of wealth [FROM: Tilman
et al., 2011, [ref.
1 below]. |
Diet
and national income. Economic development permitted people
in most nations to adopt diets offering more calories and protein
over the last 50 years. The demand for crops (measured by calories
and protein per person) in a nation's economy depends on that
nation's per-capita income: David
Tilman demonstrated this1 three years ago. In
one of his graphs (Figure A, above) the
black bars make obvious a gap in per-capita income between the
richest (group A) and poorest nations (groups F and G). Wealthier
nations also have a higher demand for “crop Calories”
than poor nations do. Tilman uses the term “crop Calories”2
to combine animal feed and human foods into one category representing
the total demand for Calories in a nation's agricultural and
food industries. Demand for crop Calories in seven income groups
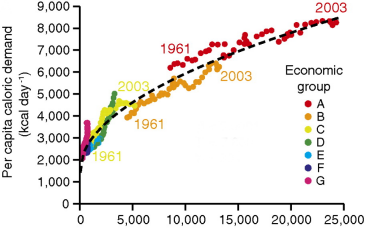
is strongly related to per-capita income: see
Figure B which combines both relationships. In poor nations
(purple dots), each person gets by on 2000—3000 crop Calories
per day; while the highly developed nations (red dots) demanded
from 6500 Calories/person fifty years ago, to 8500 Calories/person
as recently as 2005.
|
| Figure B:
Per capita demand for crop Calories per day (left),
as it depends on per capita GDP in each economic group
A–G in figure A. [FROM: Tilman et al., 2011; ref.
1 below]. |
Economic
development has also permitted people to consume more meats,
oils, refined sugars and processed foods. These foods need more
resources (land, water, fertilizer, and energy) per serving.
The dietary shift put pressure on resources, which led to more
releases of greenhouse gases (GHG) per person and overall.
Tilman's
goal was to forecast the environmental impact of agriculture
in the year 2050, by taking stock of trends in population and
economic growth, and the shift to modern diets that demand more
resources. The authors then discuss ways to meet the total demand
for crop Calories 35 years into the future. Some alternatives
impact the Earth much less than when we “stay the course”
by producing food much as we now do.
Glancing
again at Figure A, we see not only huge differences in per-capita
income between groups of nations (black bars), but also their
projected growth to 2050 (white bars). It is not in the wealthiest
nations (A), but rather in the middle-income groups B, C, D,
and E, where income per person is expected to grow the most.
In the poorest nations (G), income is not expected to grow at
all!
Tilman
estimated how a nation's yield of Calories from crops depends
on its per-capita income (in groups A to G), the amount of nitrogen
fertilizers applied to crops, the year, the precipitation, and
more. Some 80% of the variation depends on the first four factors
alone.
Demand
for Calories in food and feed is expected to double by 2050;
and demand for protein to more than double. The world's population
is expected to go up 36% from 2009 to 2050. One billion hectares
of uncultivated land would be cleared for agriculture, mainly
in the less developed world. (One hectare equals 2.5 acres.)
Because of changing diets, greenhouse gas releases would go
up by 32% per person. Altogether, growing, processing, and delivering
the global food basket would release 80% more greenhouse gases
to the atmosphere than it now does.
(Continues
. . . . next page)
|
Another
way to feed everybody in 2050 is to have people choose healthful
diets that reduce the burden of diet-related maladies mentioned
above. These diets have more fruits and vegetables, less meat,
and fewer 'empty' calories from foods having little nutritional
value, like sugar and alcohol. Tilman and Clark compiled results1
from 18 publications in which rates of type 2 diabetes, death
from heart disease, some cancers, and mortality in general were
lower among those who ate one of three alternative diets.
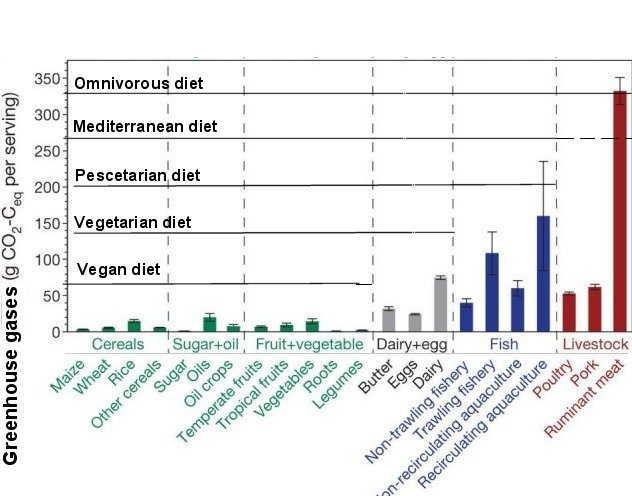 |
Figure
C : Emissions of Greenhouse Gases (GHG), per
serving*, over the life cycle of growing and producing
22 food types. *Defined by the US Dept. Agricul-ture.
[FROM: Tilman and Clark., 2014 [ref.
1 below]]. |
The three
diets are illustrated in Figure C and the pictures of food plates:
Mediterranean (rich in fish, seafood, and nuts, and containing
some meats); pescetarian (fish and seafood, fruits and vegetables,
but almost no meat); and vegetarian (fruits, vegetables, dairy
products and eggs, but no meat nor fish). These were compared
to a 'reference' diet which was a global-average, omnivorous
diet in 2009. The authors used relationships between income
and diet in each nation-group to calculate a global, income-dependent
diet, as the reference for 2050.
Tilman
and Clark1 report that emissions of greenhouse
gases per person will go up 32% by 2050 if this global dietary
shift continues. Overall emissions for the globe go up by 80%.
If alternative diets are widely chosen in the future, what are
the consequences for the environment?
Food
production already has a large impact on the Earth, according
to Tilman, who wrote, “Dietary composition strongly influences
GHG (greenhouse gas) emissions.” Growing, processing and
hauling food and feed is responsible for 25% of current emissions.
To produce this food and feed, farms and pastures now require
one-half of the land on Earth that is free
of ice. Under “business as usual,” global demand
for crop Calories will double by 2050, and demand for protein
will more than double. They reviewed an impressive 120 published
studies from which they garnered 555 “Life Cycle Analyses”
of food, feed, livestock, fisheries, and aquaculture enterprises,
and their greenhouse gas emissions3.
Some 82 foods were in their “basket.”
The
GHG emissions per serving (see Figure C)
vary tremendously among food types. Plant-based foods (in green)
have much lower emissions than animal-based foods. Ruminant
livestock (beef cattle and lamb) can digest grass and very fibrous
plant foods in their many stomachs, but ruminants need to eat
more feed to put on a pound of meat than other animals. Many
ruminants also expel methane, a potent greenhouse gas, from
their digestive tract.
What
is less well known is that producing beef or lamb (tall red
bar) yields twice the GHG emissions per serving as harvesting
and producing fish does (blue bars), and many times more than
pork or poultry (three red bars). Servings of dairy or eggs
produce fewer emissions than a plate of fish.
How
fish are caught has a large effect on GHG emissions. Catching
fish in nets trawled across the seafloor produces three times
more GHG than catching free-swimming fish in other ways. Among
cereal grains, a serving of wheat produces 60% less GHG emissions
than a serving of rice.
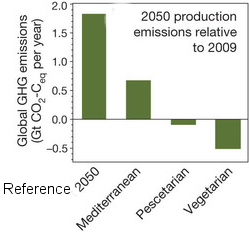 |
| Figure
D: Change in global GHG emissions from
food production after year 2009.
[Figures D and E from Tilman and
Clark, 2014 [ref. 1 below]].
|
|
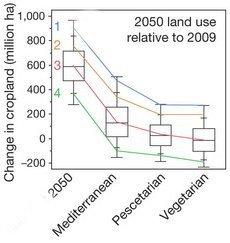 |
Figure
E: Change in area of crop land needed for
each diet, relative to year 2009. |
|
More
people can be fed on less land and with less resources if they
eat alternative diets. If for health reasons people around the
world adopt a global diet that is the average of the three alternative
diets described, no additional emissions of GHG would occur
(Figure D). There would be other benefits
to the planet: the amount of land cleared for future cultivation
would be substantially lower or even nil (Figure
E).
CITATIONS:
1. "Global
Diets link environmental sustainability and human health"-
by David Tilman and M. Clark (2014), Nature, 27 Dec.
2014, v. 515, 518-522, doi:10.1038/nature13959.
2. "Global
food demand and the sustainable intensification of agriculture",
by David Tilman, C. Balzer, J. Hill, and B. Befort (2011). Proceedings
of Nat. Academy of Sciences, v. 108, 20260--20264, Dec.
13, 2011.
3. Greenhouse gases other
than carbon dioxide (CO2) were expressed in CO2-equivalent units,
abbreviated as g CO2-Ceq.
Next
story |